DISCOVER THE MASTER DEGREE IN ANALYTICAL CHEMISTRY      |      LOGIN
 
 
Full text
 
     
  MANCO
2014 Instrumentation 

Monitoring a chemical process online by RAMAN spectrometry (785 and 532 nm)

Payet Clio


Introduction

Miniaturized spectrometers have been developed to facilitate integration of Raman technology on industrial processes. Factories are looking for more and more control of their production and understanding of the reaction kinetic by implementing more online analyses. For these reasons, IDEEL, a new institute of energetic transition, wanted to test two low cost mini Raman spectrometers.
The purpose of the project was to have a better understanding of these two spectrometers and to evaluate their performances on a real online application. The selected application concerned the chemical process monitoring of a Solvay process unit:
A+B +> C+ H2O However only the 785 nm Raman spectrometer was used because the 532 nm liquid probes had a design fault.

Experimental conditions

Experiments were made with a Raman spectrometer QE65 Pro by Ocean Optics, a laser source at 785 nm and a liquid probe.
The first concern was to study the stability of both spectrometers. Cyclohexane was analysed as a reference to establish statistical process-control charts. This was done in order to check the good use of each component of the analyser (the CCD detector and laser).
The second objective consisted in validating the spectrometers with the Solvay application. To reach that target, an experimental design was established and calibration models were developed. The experimental design was made to determine all the samples composition which were needed to build a representative calibration database.
Before all analyses the spectrometers’ acquisition parameters (integration time and averages) were optimised. Then, each sample was analysed and replicated 10 times to create the spectral data base and to make the calibration more robust.
From the spectral data base, a multivariate PLS regression was developed for all 4 component concentrations. Outliers were deleted to optimise the statistical model before applying PLS regressions. For each model, optimal factor numbers was chosen according to the root mean square error of calibration and validation.
The last experience was to analyse a new sample with known composition for validation. The optimised PLS regression model was used on a specific monitoring software and the concentration of all 4 compounds were predicted in real time.

Results

The model performances (in terms of RMSE) were not as good as expected (Figure 1). The reason was attributed to the poor quality of the spectral data base. Indeed, for some samples a significant drift of spectra was observed. The control charts allowed us to attribute this drift to the initial instability of the CCD detector’s response time. The real time monitoring of the validation sample showed none the less that the prediction was good enough with a prediction lower to 5 % (w/w).

Conclusion

The monitoring of a chemical process online proved effective with the 785 nm Raman spectometer couple to chemiometric modelling. Morever, it can be improved by optimising the acquisition of samples spectra.


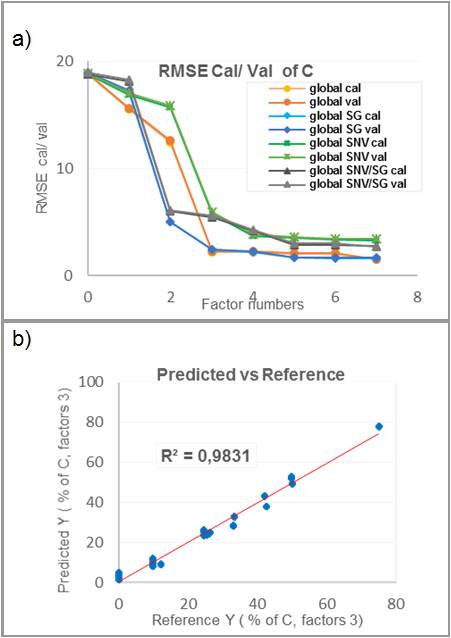
a) Optimisation of the PLS R models. b) Distribution of the residue around the right of regression.


IDEEL
Rond-point de l’Echangeur, Les Levées
69360 Solaize


logo ucbl

ANALYSE & CONTROLE, le MASTER

Batiment Bertholet - 22 avenue Gaston Berger
69622 Villeurbanne
Phone : 04-72-44-79-88
mail : master-analyse-controle@univ-lyon1.fr


DIRECTOR

Jerome RANDON

SECRETARY
Catherine BEKHALED


TECHNICAL STAFF

Herve DELEPINE
Julie BERTRAND
Didier FOURNIER

EDITORIAL OFFICE

Editorial Director : Jerome RANDON
webmastering : Chahira YAHIAOUI