
|
2014 Biology |
||||
|
Study of the interaction protein/ligand by NMR Chabannes Marie-Pia |
||||
|
Introduction NMR can be used firstly to identify precisely any amino acid of a protein which interacts with the ligand and secondly to estimate the strength of this interaction. In this research the UIM-SH3 protein was studied. Its a protein composed of 109 amino acids and is part of a larger protein which is involved in the process of protein level regulation in the cell. Experimental conditions The experiment is a titration. It requires recording several 1H-15N HSQC spectra of the protein thanks to a 600 MHz spectrometer. In these spectra each peak represents an amino acid. The protein was previously enriched in nitrogen-15. Protein was prepared in phosphate buffer at a concentration of 180 µM while the ligand was prepared in the same buffer but at a concentration of 110 mM. The experiment consists in observing the influence of the ligands presence on the chemical shift of each amino acid on the HSQC spectrum of the protein. To do that, the ligand is gradually added in the NMR tube containing the protein and a HSQC spectrum is recorded after each addition. The ligand is added until a ligand/protein concentration ratio of approximately 80. After the spectrum overlapping, the amino acids which have the greatest variation of chemical shift are identified. Titration curve is drawn for each amino acids. These are shown in Figure 1. These curves represent the change in the chemical shift depending on the ratio of ligand / protein concentration. Moreover thanks to a mathematical software, the dissociation constant Kd associated with this interaction can be calculated : the smaller the Kd, the stronger the interaction. To calculate dissociation constant it was assumed that the interaction followed a 1 :1 model : it means one protein molecule interacts with one ligand molecule. Results Figure 1 shows that the interaction corresponds to amino acids 217, 218, 223, 224, 232 and 233. It corresponds to several interaction sites whose main site is revealed by the constant dissociation. Therefore, 223 and 224 residues have a Kd of aproximately 3 mM, while the others are higher. So this is where the interaction is the strongest. Figure 2 is a representation of UIM-SH3 with in red the amino acids which interact with the ligand. All the interaction sites are located on the SH3 part of the protein, UIM portion does not interact at all with the ligand. Conclusion With NMR, we were able to localize the interaction between the ligand and the protein mainly at residues 223 and 224 and to estimate the dissociation constant around mM. Since two sites were identified, a 2 :1 model (one protein molecule intarcts with two ligand molecules) could be tested to calculate the dissociation constant. Others ligands were tested with similar results. |
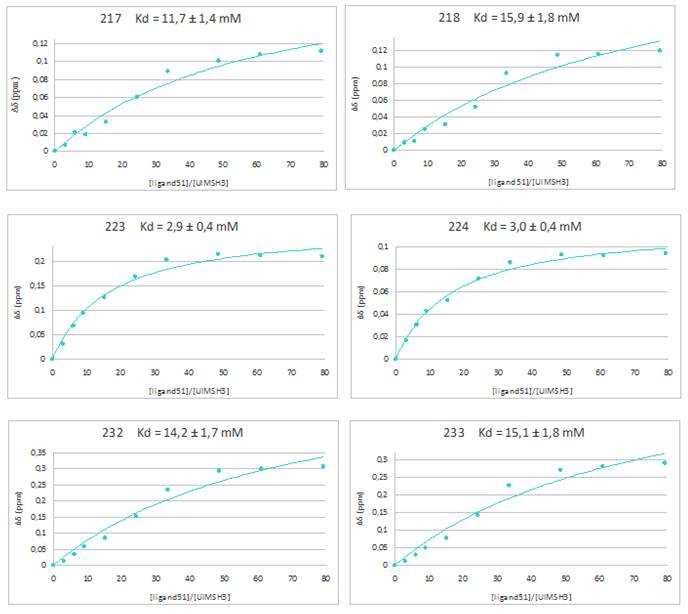 Titration curves of residues that have suffered the greatest change in chemical shift 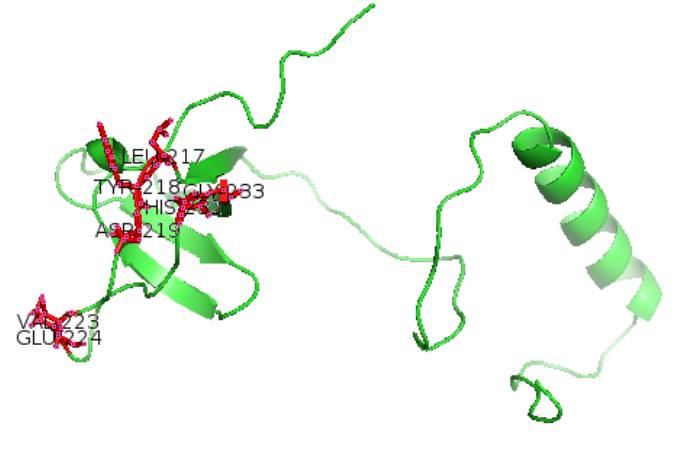 Representation of the UIM-SH3 protein with the major sites of interaction (green : UIM-SH3 ; red : areas of interaction) |
|||
|
Institut des Sciences Analytiques |
|
|||
ANALYSE & CONTROLE, le MASTER Batiment Bertholet - 22 avenue Gaston Berger 69622 Villeurbanne Phone : 04-72-44-79-88 mail : master-analyse-controle@univ-lyon1.fr |
DIRECTOR Jerome RANDON SECRETARY |
TECHNICAL STAFF Herve DELEPINE Julie BERTRAND Didier FOURNIER |
EDITORIAL OFFICE Editorial Director : Jerome RANDON webmastering : Chahira YAHIAOUI |