|
Introduction
When an analysis laboratory uses simplified methods, or wants to change its methods that are currently used, itís necessary to make a comparison with an outside laboratory that is COFRAC validated and which uses normalized methods.
We will take the example of a laboratory sewage treatment plant water analysis.
This laboratory works with kits, that look like tubes, in order to obtain the concentration of nitrogen, ammonium, nitrates, nitrites, DOC (chemical oxygen demand), DOB5 (biochemical oxygen demand) or phosphorus. They are filling with reagents to enable the reaction with sewage and can get concentrations.
Experimental conditions
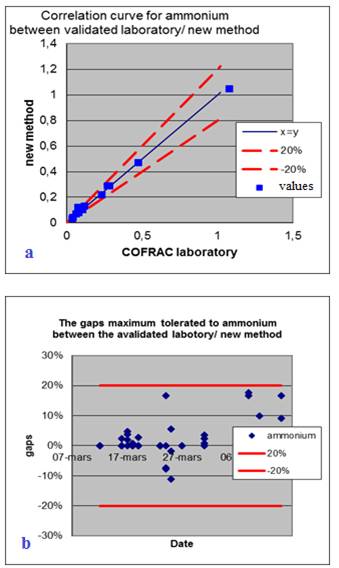
During the comparison we have to use the same samples and do on the same day to avoid having a possible evolution of these. After analysis we assemble results to do correlation curves. To have a good representation it is necessary to have at least 20 dots (figure 1a). Also we can do statistics tests to confirm the equivalence between the two methods.
To finish we could prove the respect of the average differences tolerated (figure1b).
Results
When the analysis was conducted in double, tests and curves show there are equality of means and variances and no gaps.
In fact the Fisher test reveals that Fobs < Ftheo and the Student test reveals that tcalc < ttheo.
Moreover, in our case the correlation coefficient that we obtained is 0,99 (This one should tend towards 1 for perfect correlation).
The change of method will have no impact on results that is to say the change is possible.
Conclusion
All these results show there are no bias between the two methods, so the laboratory could change the kits that are currently used with new kits. This change will save time and produce profit.
|
|

a) Correlation curve of ammonium between new method and the COFRAC laboratory
b) The graphic of gaps maximum tolerated to the ammonium.
|


