
|
2015 Qualification and Validation |
||||
|
Development and Validation of a quantification method for pesticides in water samples with LC-ESI-TOF-MS Belardi Thomas |
||||
|
Introduction The simultaneous analysis and quantification of small molecules at low concentrations levels in complex samples requires the use of a highly sensitive and specific detection system down-stream a separation step. Experimental conditions The isocratic liquid chromatography separation was implemented in the reversed phase mode, with a Zorbax C18 2.1 mmi.d. x 50mm (pd = 1.8 µm) column and a 40/60 ACN/water mobile phase at a flow rate of 0.35 mL/min. The injection volume was 1.5 µL. The mass spectrometer system was a 6230 LC-TOF from Agilent Technologies. This mass spectrometer was equipped with an electrospray ionization source. Each solute was quantified by extracting the corresponding peak area at the m/z ration of the (M-H)+ adduct with a detection window fixed at 20 ppm. Results The biases of calculated concentrations were globally similar; around 30% bias for the LOQ level and less than 10% for other concentration levels. Spray of bias for peak areas at the LOQ level was higher but has a standard distribution due to the higher uncertainty percentage for low concentration levels. Conclusion As the selected AMDs for LOQ and other concentration levels were respectively 40% and 10%, the calibration curve study was validated. |
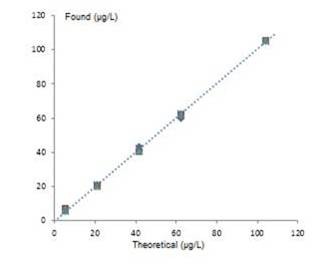 Calibration curve for the 5 levels of concentration for one of the pesticides 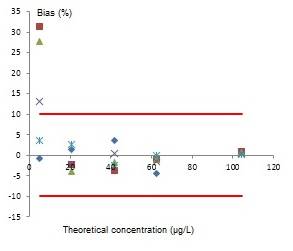 Biases observed for the 5 levels of concentration for one of the pesticides |
|||
|
Institut des Sciences Analytiques |
|
|||
ANALYSE & CONTROLE, le MASTER Batiment Bertholet - 22 avenue Gaston Berger 69622 Villeurbanne Phone : 04-72-44-79-88 mail : master-analyse-controle@univ-lyon1.fr |
DIRECTOR Jerome RANDON SECRETARY |
TECHNICAL STAFF Herve DELEPINE Julie BERTRAND Didier FOURNIER |
EDITORIAL OFFICE Editorial Director : Jerome RANDON webmastering : Chahira YAHIAOUI |